pygmt.Figure.hlines
- Figure.hlines(y, xmin=None, xmax=None, pen=None, label=None, no_clip=False, panel=False, perspective=None)
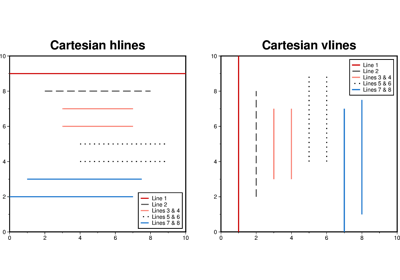
Plot one or multiple horizontal line(s).
This method is a high-level wrapper around
pygmt.Figure.plotthat focuses on plotting horizontal lines at Y-coordinates specified by theyparameter. Theyparameter can be a single value (for a single horizontal line) or a sequence of values (for multiple horizontal lines).By default, the X-coordinates of the start and end points of the lines are set to be the X-limits of the current plot, but this can be overridden by specifying the
xminandxmaxparameters.xminandxmaxcan be either a single value or a sequence of values. If a single value is provided, it is applied to all lines. If a sequence is provided, the length ofxminandxmaxmust match the length ofy.The term “horizontal” lines can be interpreted differently in different coordinate systems:
Cartesian: lines are plotted as straight lines.
Polar: lines are plotted as arcs along a constant radius.
Geographic: lines are plotted as arcs along parallels (i.e., constant latitude).
- Parameters:
y (
float|Sequence[float]) – Y-coordinates to plot the lines. It can be a single value (for a single line) or a sequence of values (for multiple lines).xmin/xmax – X-coordinates of the start/end point(s) of the line(s). If
None, defaults to the X-limits of the current plot.xminandxmaxcan be either a single value or a sequence of values. If a single value is provided, it is applied to all lines. If a sequence is provided, the length ofxminandxmaxmust match the length ofy.pen (
str|None, default:None) – Pen attributes for the line(s), in the format of width,color,style.label (
str|None, default:None) – Label for the line(s), to be displayed in the legend.no_clip (
bool, default:False) – Do not clip lines outside the plot region. Only makes sense in the Cartesian coordinate system. [Default isFalseto clip lines at the plot region.]panel (
int|Sequence[int] |bool, default:False) –Select a specific subplot panel. Only allowed when used in
Figure.subplotmode.Trueto advance to the next panel in the selected order.index to specify the index of the desired panel.
(row, col) to specify the row and column of the desired panel.
The panel order is determined by the
Figure.subplotmethod. row, col and index all start at 0.perspective (
str|bool|None, default:None) – Select perspective view and set the azimuth and elevation angle of the viewpoint. Refer topygmt.Figure.plotfor details.
Examples
>>> import pygmt
>>> fig = pygmt.Figure()
>>> fig.basemap(region=[0, 10, 0, 10], projection="X10c/10c", frame=True)
>>> fig.hlines(y=1, pen="1p,black", label="Line at y=1")
>>> fig.hlines(y=2, xmin=2, xmax=8, pen="1p,red,-", label="Line at y=2")
>>> fig.hlines(y=[3, 4], xmin=3, xmax=7, pen="1p,black,.", label="Lines at y=3,4")
>>> fig.hlines(y=[5, 6], xmin=4, xmax=9, pen="1p,red", label="Lines at y=5,6")
>>> fig.hlines(
...     y=[7, 8], xmin=[0, 1], xmax=[7, 8], pen="1p,blue", label="Lines at y=7,8"
... )
>>> fig.legend()
>>> fig.show()